Understanding Your Hearing Test
The way to a hearing aid fitting often begins with a feeling that your hearing is not as it should be or that your hearing has worsened. This feeling may originate from situations where you have to ask for sentences to be repeated or when other people complain that the television is too loud while you regard it as comfortable. Making a serious mistake, family pressure, or safety concerns are also reasons people often cite for seeking a hearing solution.
If you suspect a hearing loss contact a hearing care professional as soon as possible.
A hearing care professional determines with the help of a hearing test whether or not a hearing loss is present. If no hearing loss is present, you won't need any further help. In the case where a hearing loss is present, the kind and degree of your hearing loss is determined individually for each ear and entered in an audiogram.
How to Read Your Hearing Test
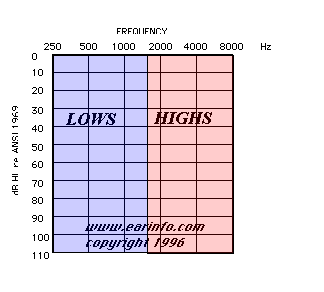
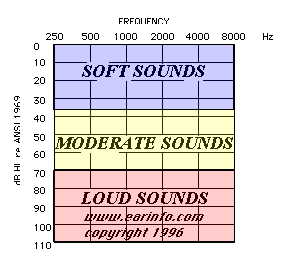
Hearing is graphed on an audiogram, a graph of the softest sounds you can hear. The graph is laid out like a piano keyboard, with low to high frequencies (low to high pitches) going from left to right, ... and the graph is laid out from soft sounds on the top to loud sounds on the bottom.
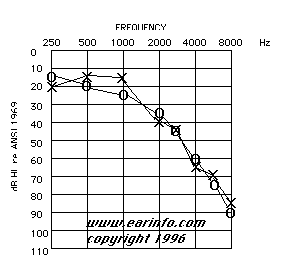
So once your graph is filled in (x represents the left ear, o the right), ... it shows your hearing sensitivity for different frequencies at different intensities (at different pitches and different volumes).
Hearing is NOT measured in percentages. Instead, it is measured in an arbitrary unit of loudness called the DECIBEL. The decibel (dB, or dB HL) is a logrithmic scale. Physically, every 6 dB increase represents a doubling of sound pressure level. Perceptually, every 10 dB increase sounds twice as loud.
Every increase of 10 decibels (10 dB) sounds twice as loud. 20 dB sounds twice as loud as 10 dB... 40 dB sounds twice as loud as 30 dB and 8 times as loud as 10 dB (10 to 20 to 30 to 40 = 2 x 2 x 2 = 8).
Normal hearing ranges from 0 to 20 dB in all frequencies.
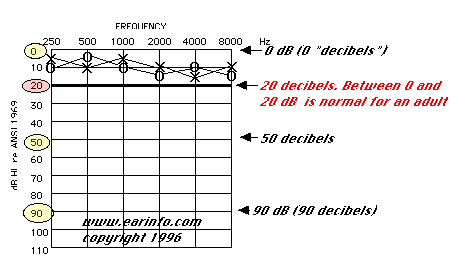
From here on, the assumption is that you have a sensorineural hearing loss (that you have nerve damage to the inner ear). Nerve damage, unless sudden, is permanent.
For conductive hearing losses, see your otolaryngologist (your ENT physician). For sudden hearing losses, see your otolaryngologist within a day. If you cannot, get an immediate medical evaluation elsewhere.(next)
If you have a standard audiogram, highlight the 20 dB line that crosses the graph from left to right.
If all of the X's (for the left ear) and all of the 0's (for the right ear) fall above the line you just drew, you have normal hearing. If anything is below that 20 dB line, you have a hearing loss.
Your hearing loss is classified according to how far down the graph the marks go, and in what freqencies the loss occurs. (The next page requires about 55 seconds to load at 14.4kbaud. Please open your browser to at least as wide as the row of glass beads below this paragraph.) Here are some common hearing losses...
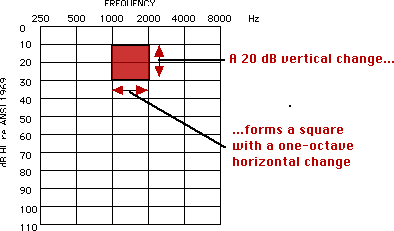
In a standard audiogram, the numbers across the top of the graph start at 250 Hertz ("Hz," or cycles per second) and proceed to 8k Hz (8000 cycles per second), with the following one octave intervals: 250 / 500 / 1k / 2k / 4k / 8k. Every octave -- every interval across the top -- forms a square with every 20 decibel (20 "dB") change going down.
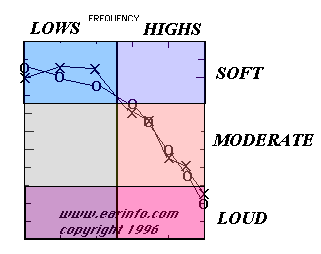
Some other common variations include putting the left and right ears on different graphs, and using a different interval for the frequencies across the top. The most common variant uses the following frequency intervals: 250 / 500 / 1k / 2k / 3k / 4k / 6k / 8k. If you have this kind of graph, the right half of the pattern of your hearing test will be stetched out, as shown below, on the right:
