|
|
|||||
|
|
|
|
How to Read Your Hearing TestHearing is graphed on an audiogram, a graph of the softest sounds you can hear. 
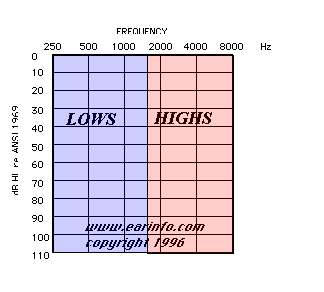
The graph is laid out like a piano keyboard, with low to
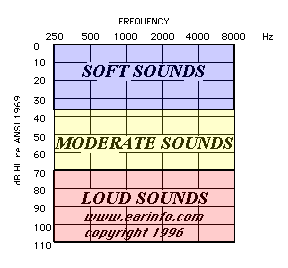
high frequencies (low to high pitches) going from left to right, . . . . . . and the graph is laid out from soft sounds on the
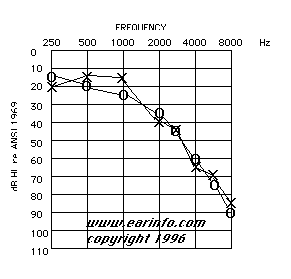
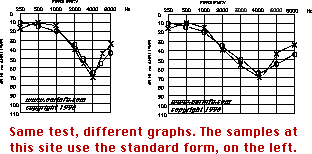
top to loud sounds on the bottom. So once your graph is filled in (x represents the left ear,
o the right),... ... it shows your hearing sensitivity for different frequencies
at different intensities (at different pitches and different volumes). Hearing is NOT measured in percentages. Instead, it is measured
in an arbitrary unit of loudness called the DECIBEL. The decibel (dB,
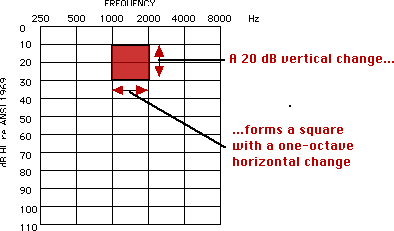
or dB HL) is a logrithmic scale. Physically, every 6 dB increase represents
a doubling of sound pressure level. Perceptually, every 10 dB increase
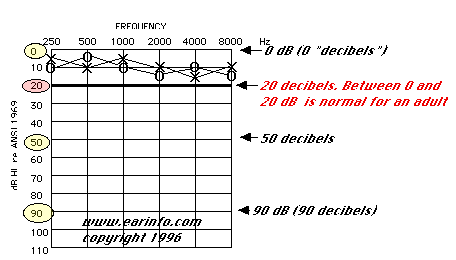
sounds twice as loud. Normal hearing ranges from 0 to 20 dB in all frequencies. From here on, the assumption is that you have a sensorineural hearing loss (that you have nerve damage to the inner ear). Nerve damage, unless sudden, is permanent. For conductive hearing losses, see your otolaryngologist (your ENT physician). For sudden hearing losses, see your otolaryngologist within a day. If you cannot, get an immediate medical evaluation elsewhere.(next) If you have a standard audiogram, highlight the 20 dB line that crosses
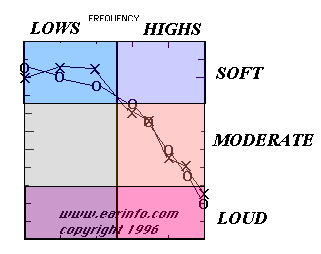
the graph from left to right. If all of the X's (for the left ear) and all of the 0's (for the right ear) fall above the line you just drew, you have normal hearing. If anything is below that 20 dB line, you have a hearing loss. Your hearing loss is classified according to how far down the
graph the marks go, and in what freqencies the loss occurs. (The
next page requires about 55 seconds to load at 14.4kbaud. Please
open your browser to at least as wide as the row of glass beads
below this paragraph.)
|
|
| ©2005 EarInfo.com | Home • Find a hearing professional •Insiders Report • |

